
Quebec City weather in November
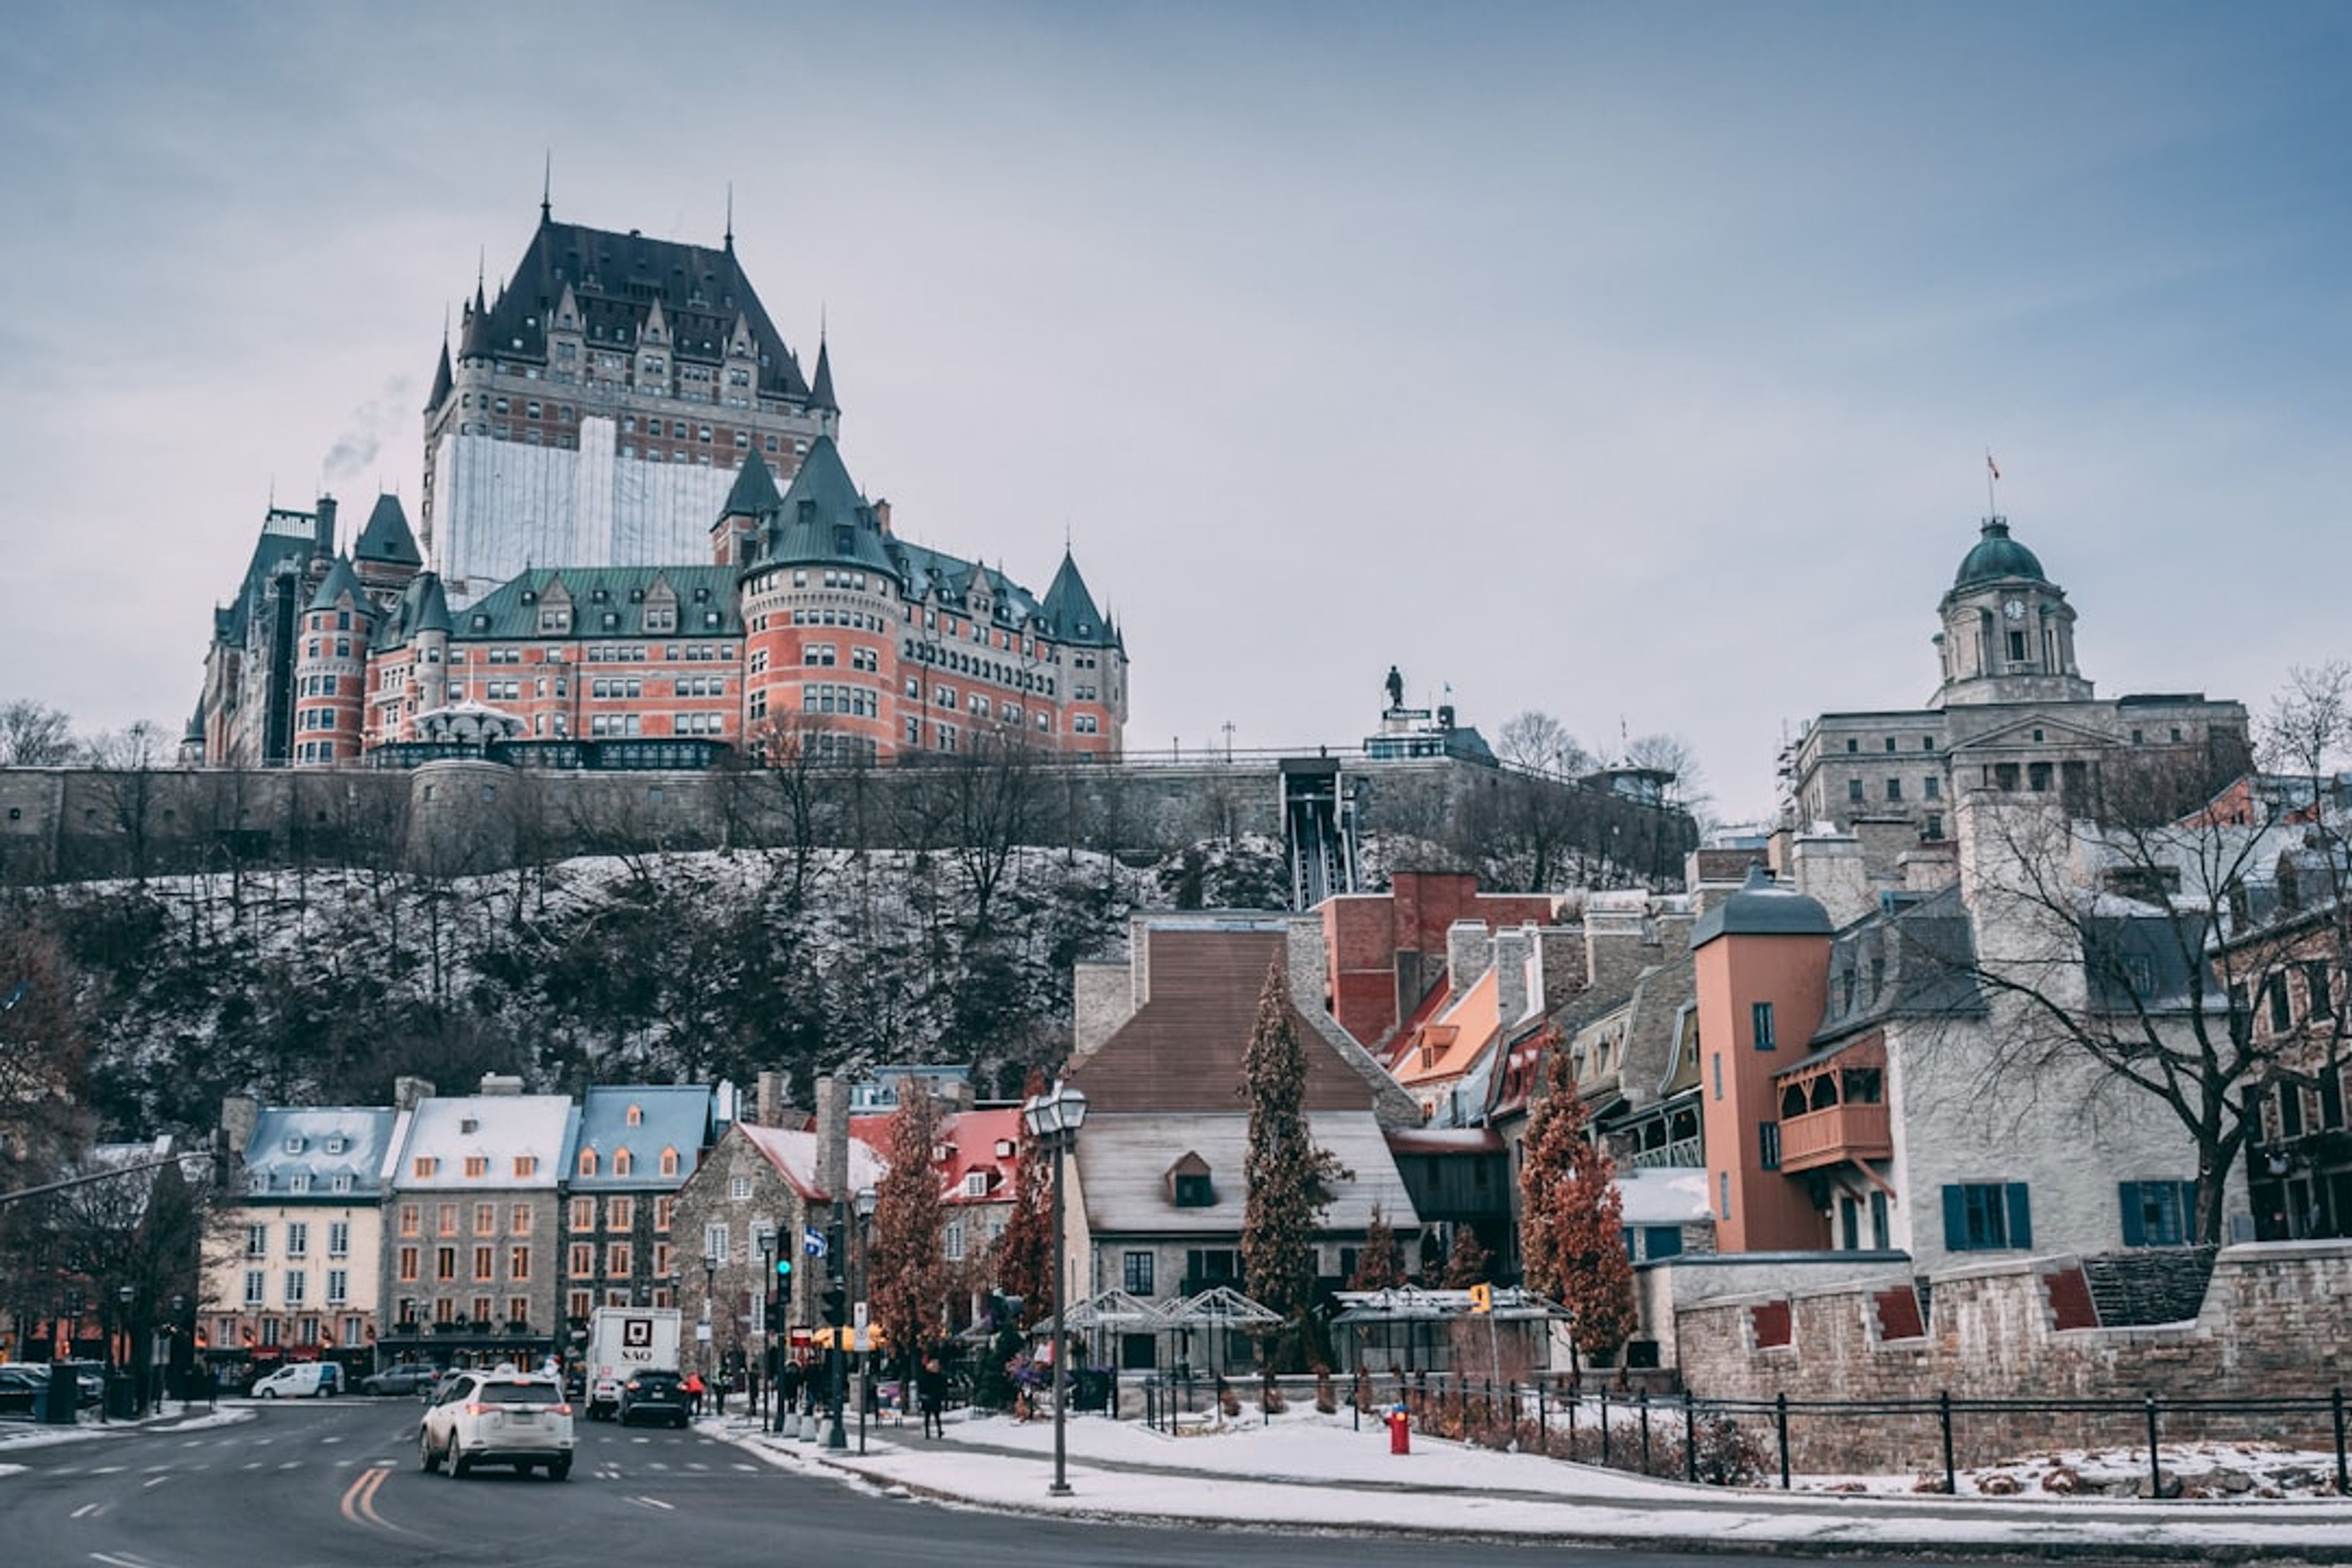
Quebec City in November averages 2°C (36°F) and 96 mm of rain.
Of the twelve months in Quebec City, November is the fifth coldest and the fifth driest.

- Average temp
- 2°C (36°F)
-1–6°C · 30–42°F
- Rainfall
- 96 mm
Showers likely
- Sunshine
- —
What is Quebec City like in November?
Daytime
Days are cool.
Rain
Some rain is likely; pack for showers.
Evening
Evenings are cooler. A layer helps after sunset.
What should I pack for Quebec City in November?
A light rain jacket
About 96 mm falls this month — showers rather than washouts.
A warm mid-layer
Nights drop to around -1°C (30°F).
November compared with October and December
November in Quebec City is 6.1°C cooler than October and 27 mm drier than it, which averages 8°C (47°F).
November in Quebec City is 8°C warmer than December and 12 mm drier than it, which averages -6°C (22°F).
Daylight in Quebec City in November
On 15 November the sun is up for 9 hours 22 minutes in Quebec City, rising about 06:48 and setting about 16:10 local time.
November ends 1 hour 10 minutes shorter than it begins, so the last week of the month is a different length of day from the first.
That is 6 hours 29 minutes short of June, the longest-lit month here.
Where to stay in Quebec City
Dates are a starting point for November.
Travel guides for Quebec City
What to read before you book.
Quebec City weather by month
TemperatureRainfall
How November compares with the rest of the year
November is highlighted. Every other month links to its own page.
| Month | Average | Rainfall |
|---|---|---|
| January | -10°C / 15°F | 79 mm |
| February | -8°C / 18°F | 87 mm |
| March | -3°C / 27°F | 82 mm |
| April | 5°C / 40°F | 106 mm |
| May | 12°C / 54°F | 89 mm |
| June | 17°C / 63°F | 118 mm |
| July | 20°C / 69°F | 119 mm |
| August | 20°C / 67°F | 103 mm |
| September | 15°C / 59°F | 115 mm |
| October | 8°C / 47°F | 123 mm |
| November | 2°C / 36°F | 96 mm |
| December | -6°C / 22°F | 109 mm |
Check another month
This is the month you are reading. Change either side to look at another.
FAQs about Quebec City in November
November climate averages for Quebec City, 1991–2020.
Quebec City averages 2°C (36°F) in November, ranging from about -1°C (30°F) at night to 6°C (42°F) in the afternoon. That is a 1991–2020 average, so an individual week can run either side of it.
Some. About 96 mm falls across November, enough to need a light jacket but not enough to reshape a trip.
Yes. November averages 2°C (36°F) against -6°C (22°F) in December — 8°C warmer.
November is 6.1°C cooler than October, and 27 mm drier.
It is outside the easiest window. The most comfortable stretch here is May to October; November sits outside it, which usually means more heat, more rain, or both — worth it if you would rather have the place to yourself.
This page does not show today's weather. It is a 1991–2020 climate normal from Meteostat — a long-run average of what November is usually like, which is what you want when booking months ahead. For today or the coming week, check a live forecast.
About 9 hours 22 minutes of daylight in mid-November, against 15 hours 51 minutes in June and 8 hours 33 minutes in December.
On 15 November, sunrise is about 06:48 and sunset about 16:10 local time. Both shift across the month — the month ends 1 hour 10 minutes shorter than it starts.